I have recently bought a used spectrum analyzer. With such equipment, a new world of measurement opened in front of me. I have lots of RF devices awaiting for measurement at home. I was curious about signal purity of the popular Si-570 clock signal source.
A rotary encoder for the RTW-SDR-LOCALOSCILLATOR board that was described in this WEB page months ago is a good candidate for spectrum analyser testing. I fitted a SMA female conector at balun output and took some pictures with my mobile phone. Quality is not good but enough for this purpose.
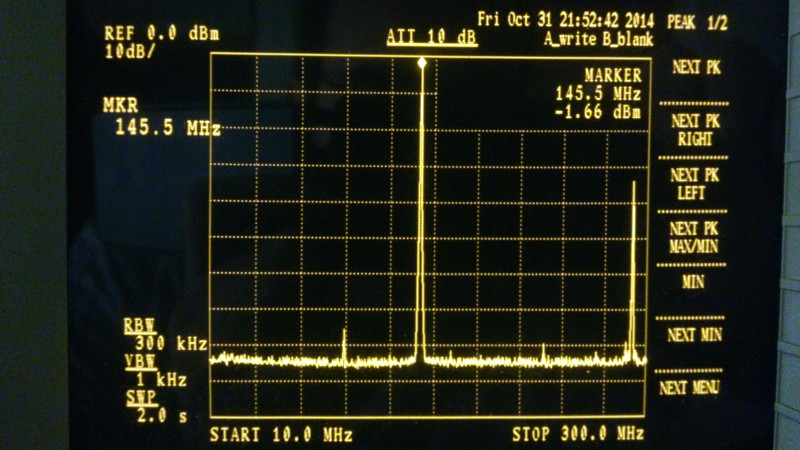
An old Advantest R3271 100 Hz - 26.5 GHz spectrum analyzer was used for making this series of measurements. Measured Si-570 chip is LVDS version with a frequency range of 10-280 MHz and a supply voltage of 3.3V.
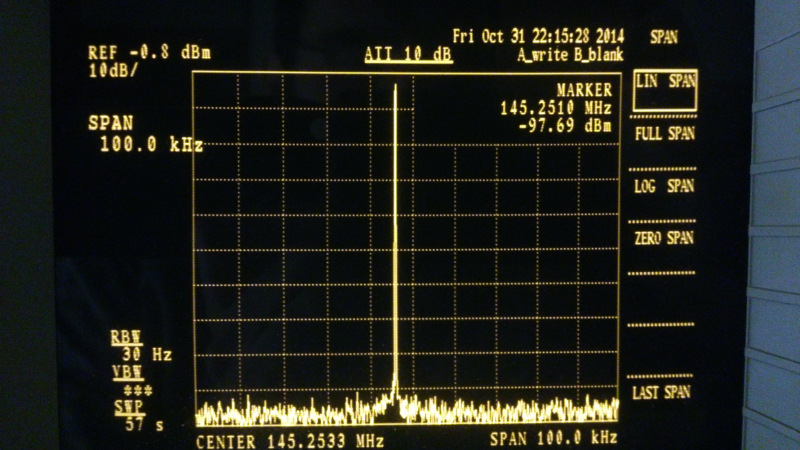
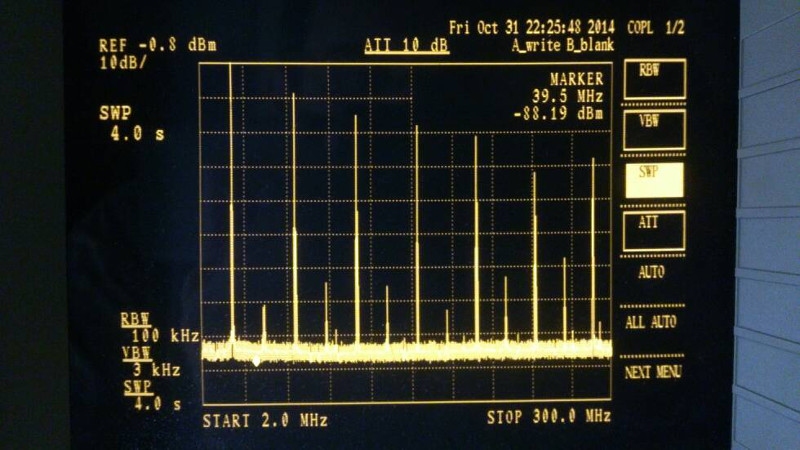
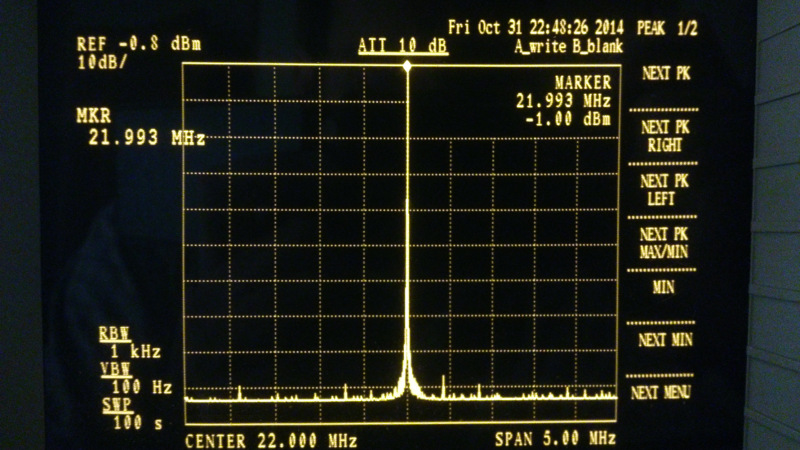
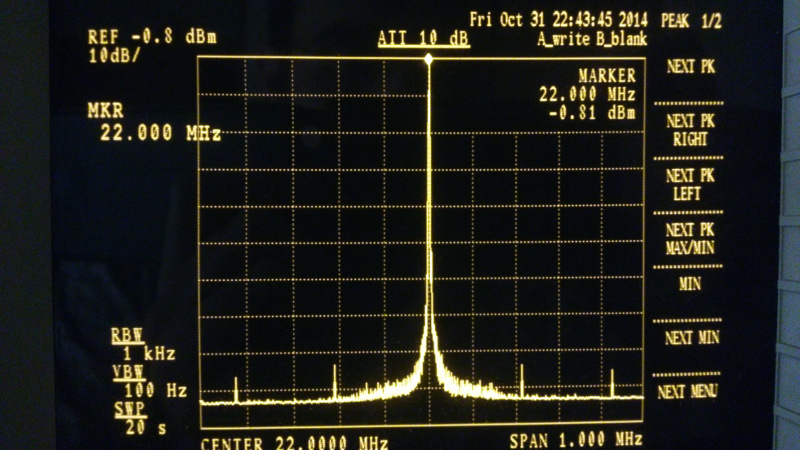
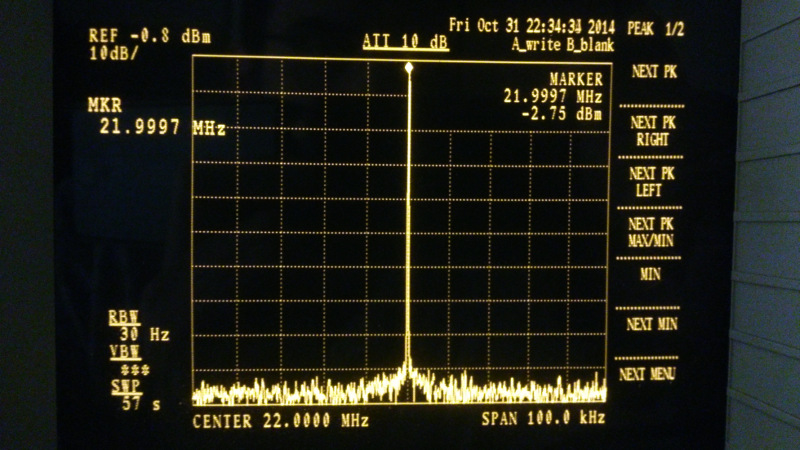
Results were surprisingly good. Spurs were 75dB lower or more than the main signal. Phase noise is pretty good, at least up to the limits of my spectrum analyzer dynamic range.
  Copyright (c)  2013 Ramiro Aceves .
  Permission is granted to copy, distribute and/or modify this document
  under the terms of the GNU Free Documentation License, Version 1.2
  or any later version published by the Free Software Foundation;
  with no Invariant Sections, no Front-Cover Texts, and no Back-Cover
  Texts.  A copy of the license is included in the section entitled "GNU
  Free Documentation License".