Attenuators are very useful devices at our RF laboratory. If we have a signal generator of a fixed level, we can get different levels using different attenuator values. Attenuators are also useful for improving input or output return loss of devices. For example, if a device presents an input of SWR=3:1, that means that the return loss is -6 dB. If we place for example, a 6 dB attenuator in front of the device, the return loss will be improved by twice the attenuator value, such is -18 dB.-18 dB return loss is the same as an SWR ratio of 1.29:1. Not too bad, is not it?
Here I will describe how to build a simple unit that works well for HF work.
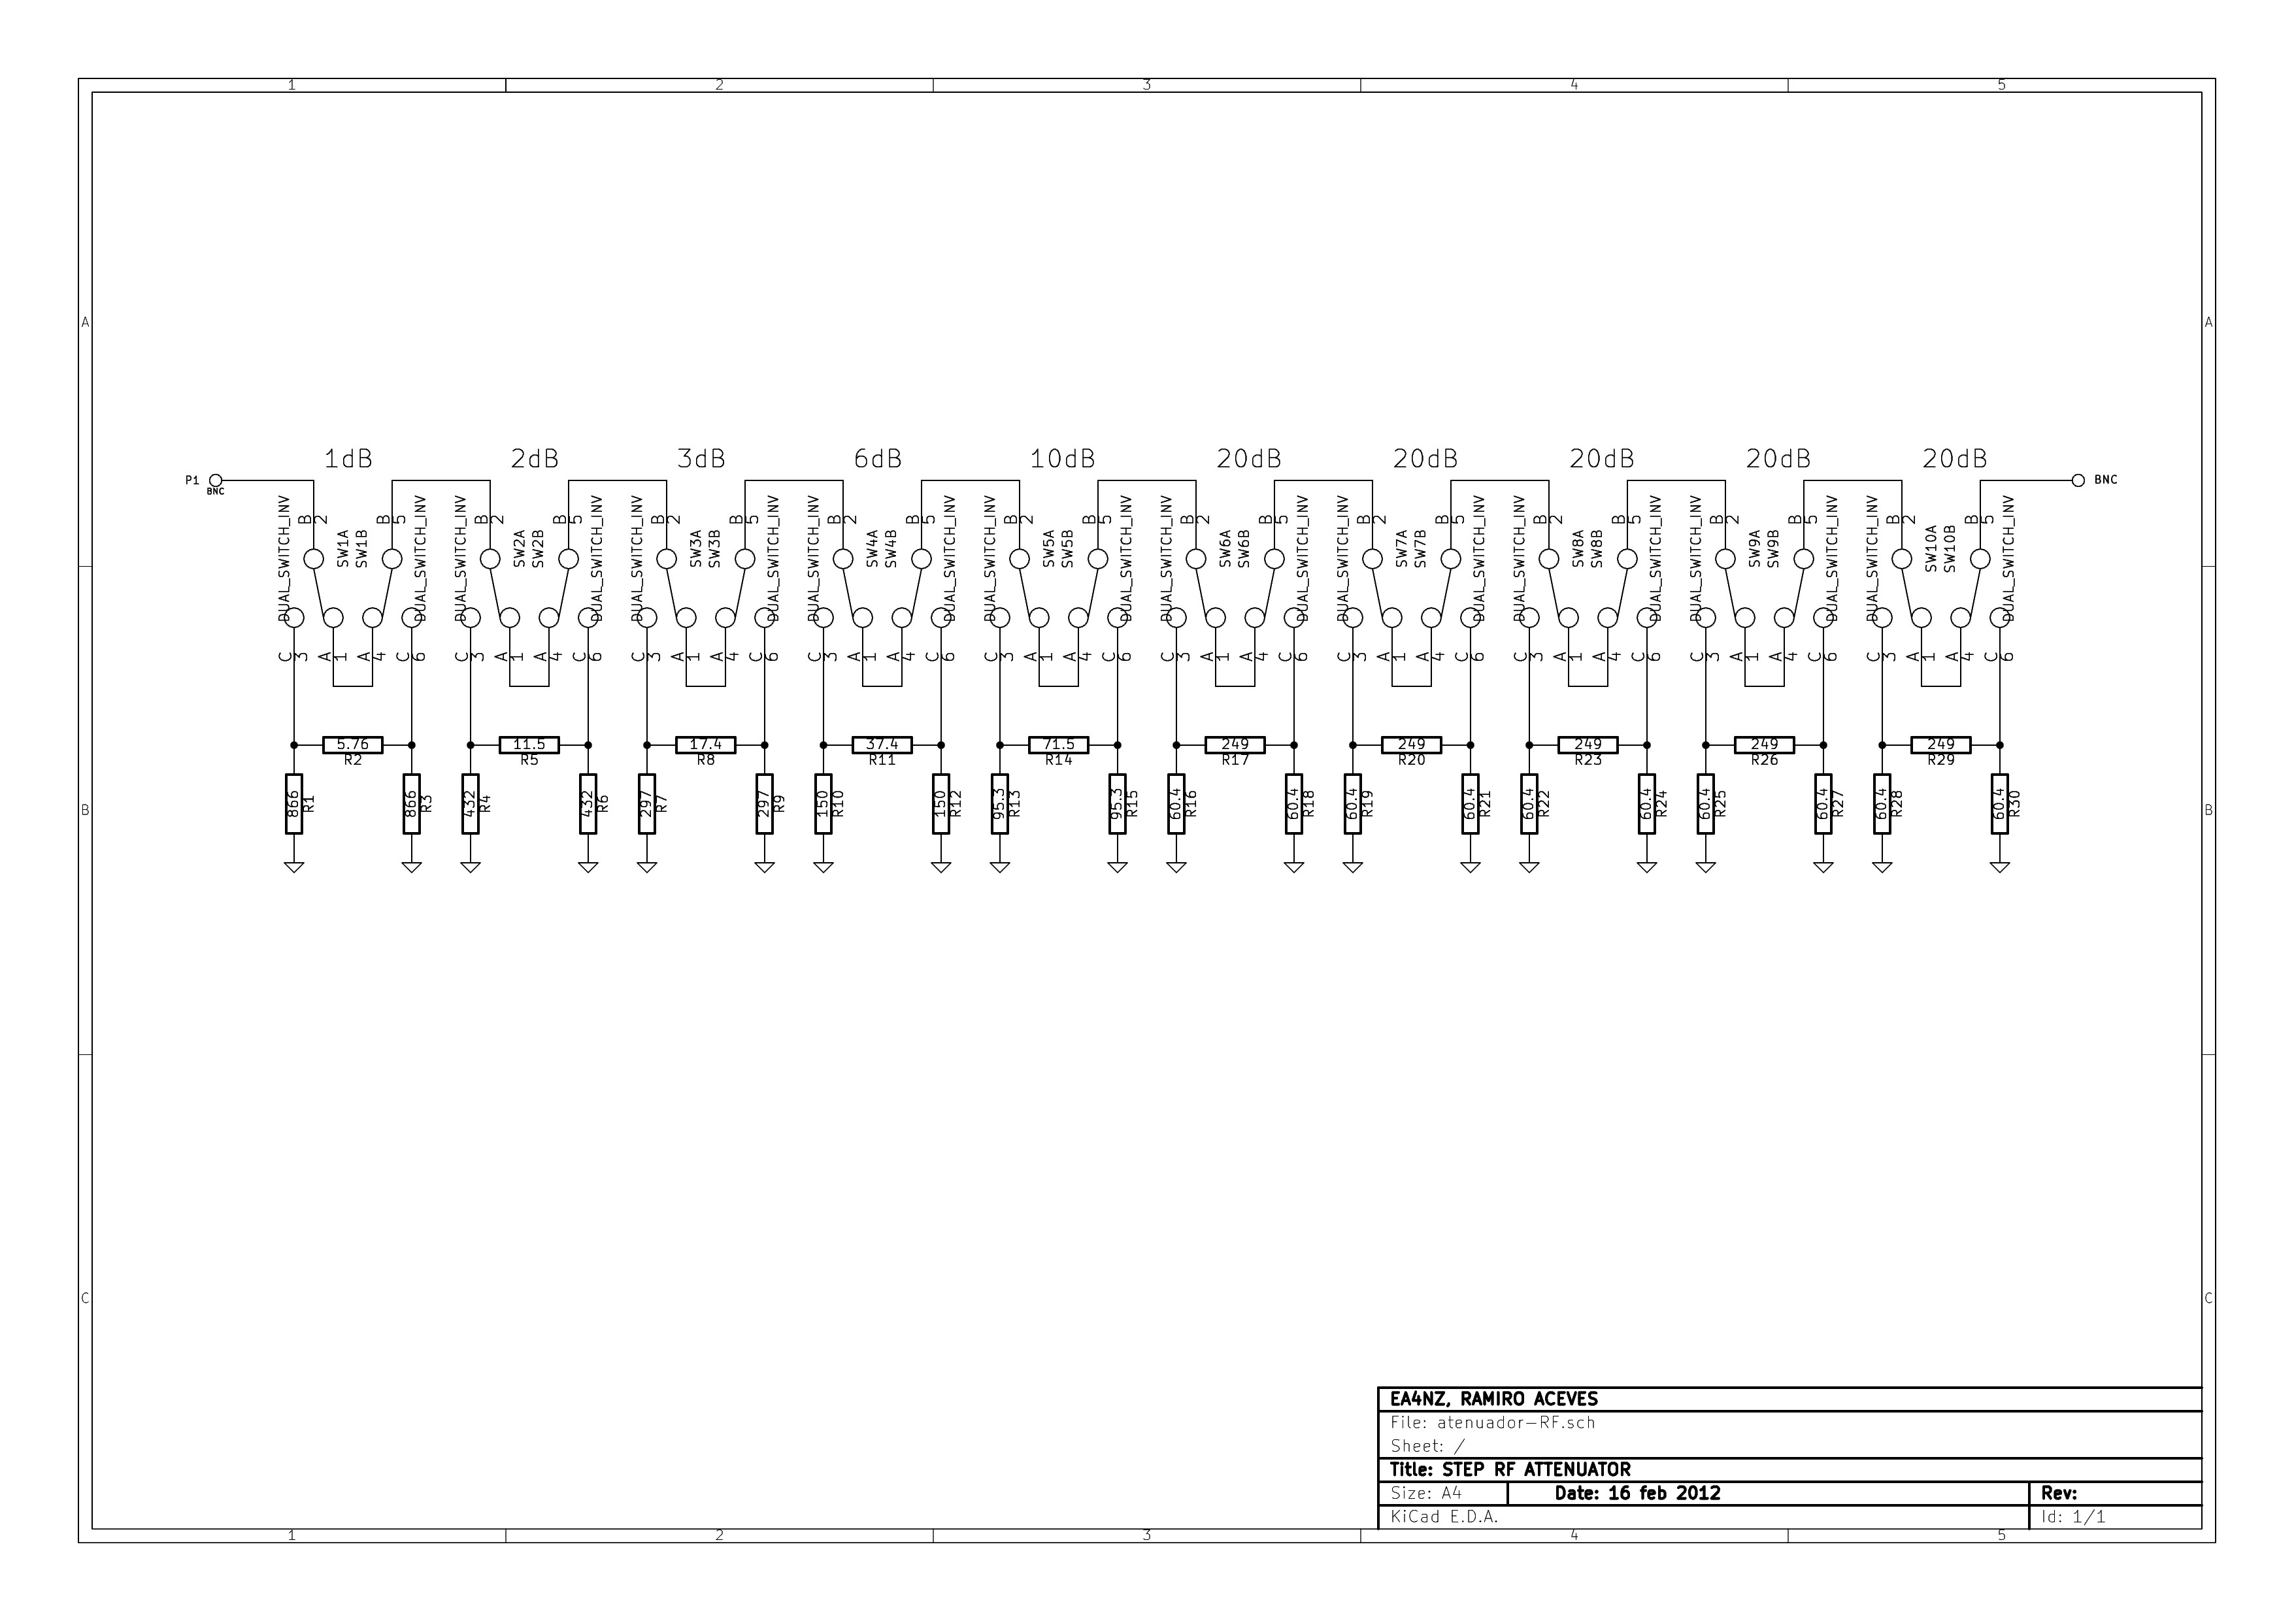
Attenuator design formulas are very easy to manage, but even easier is using QUCS attenuator calculator. QUCS is the Quite Universal Circuit Simulator, is free software and works very well. I used QUCS to calculate the following step attenuations:
1,2,3,6,10,20,20,20,20,20 dB
Here is the schematic of the step attenuator (KICAD free software):

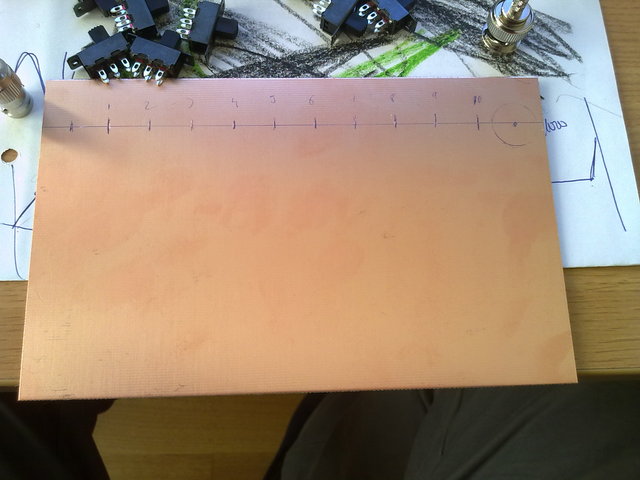
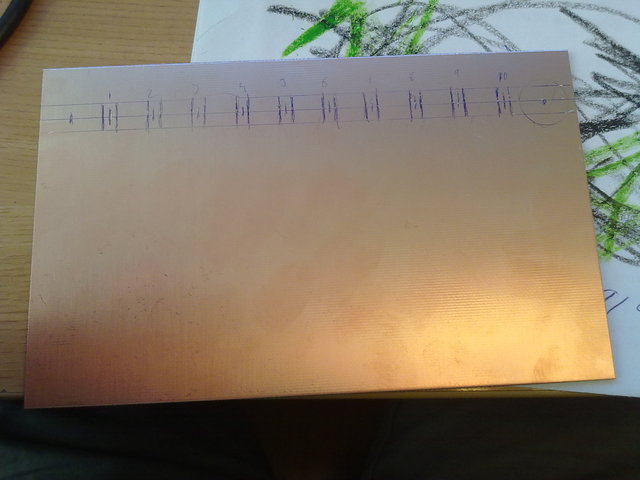
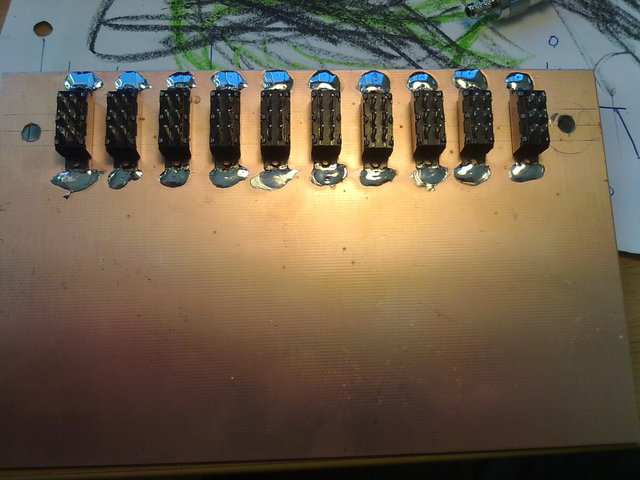
Attenuator construction is a bit tricky and you will need some patience and skills. As pictures speak for themselves, I will not describe it further. Watch the pictures and that is all. I have used cheap DPDT switches, single layer PCB board and 1/4 W resistors
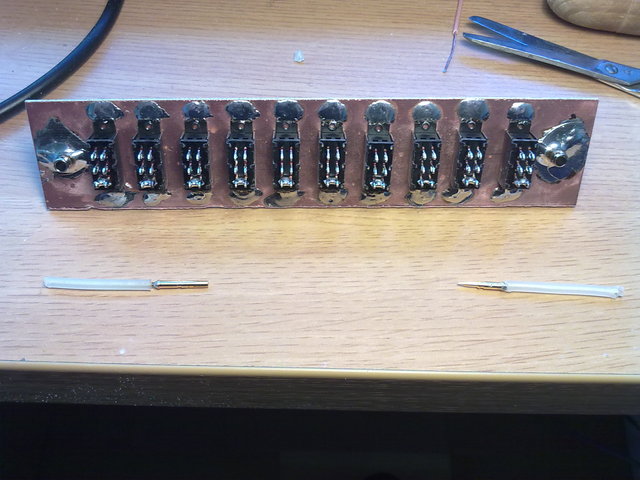
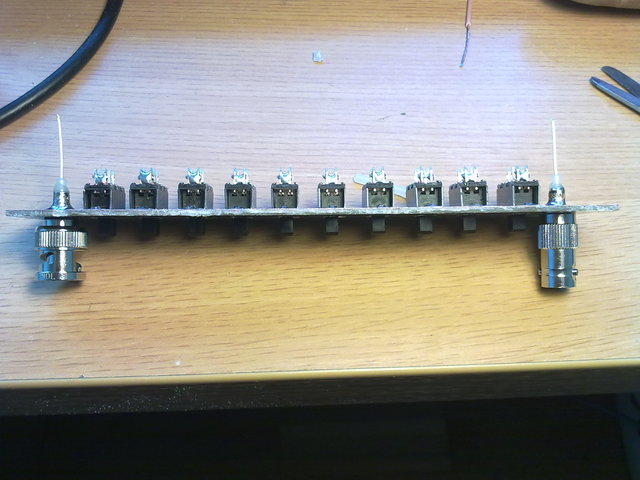
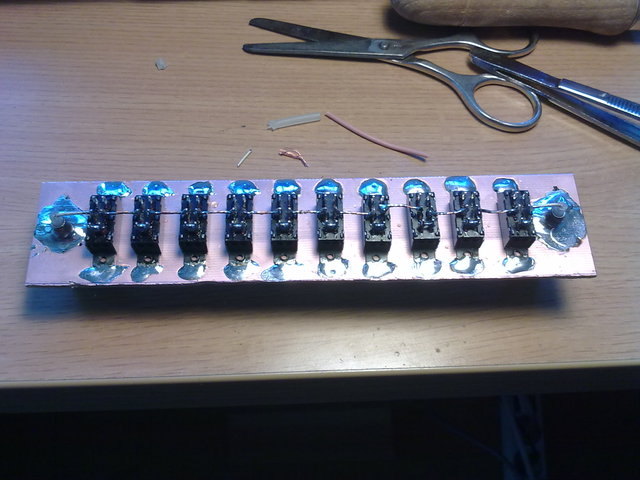
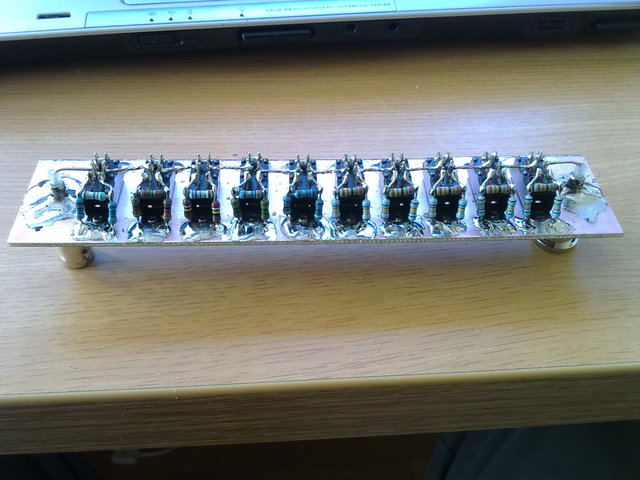
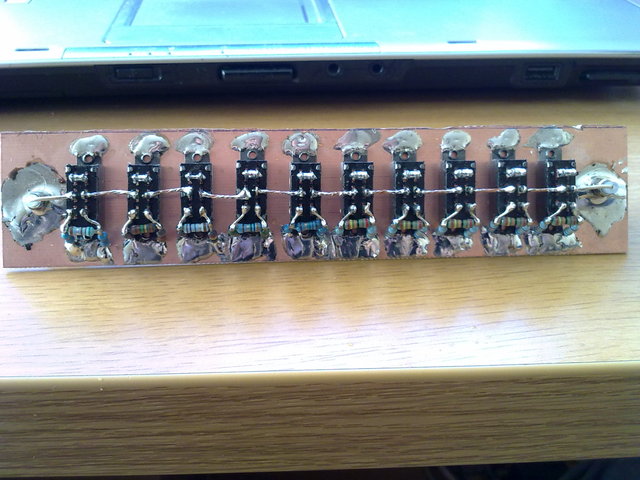
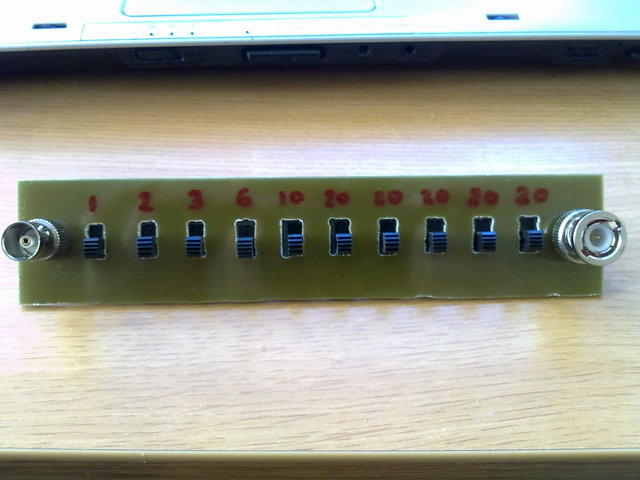
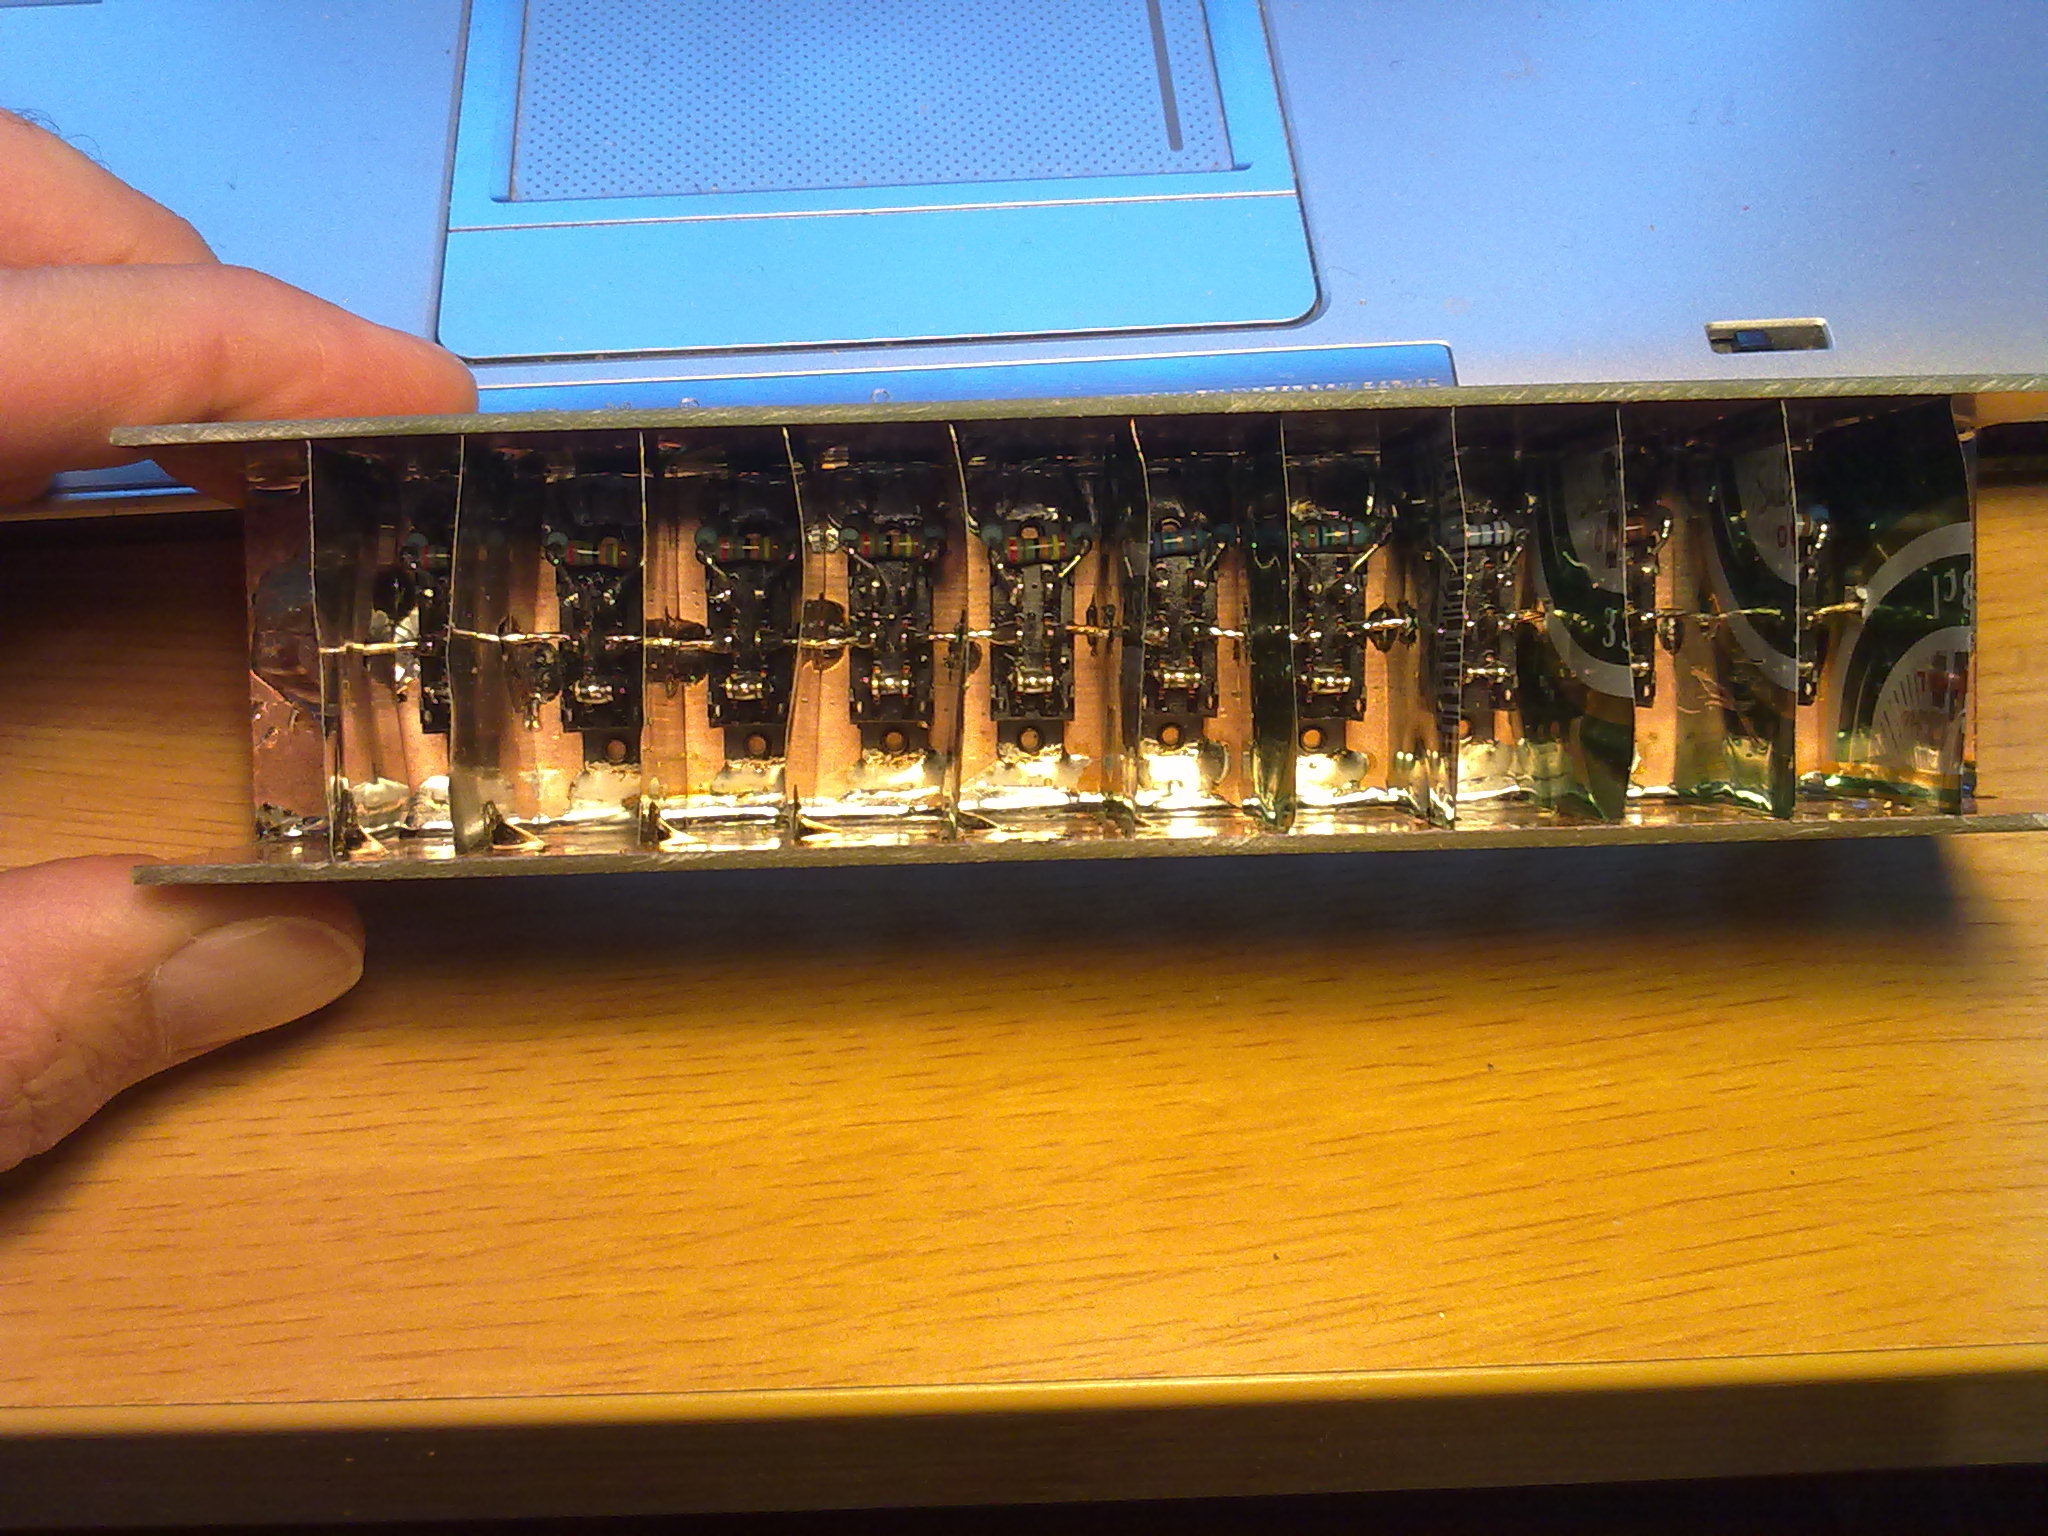
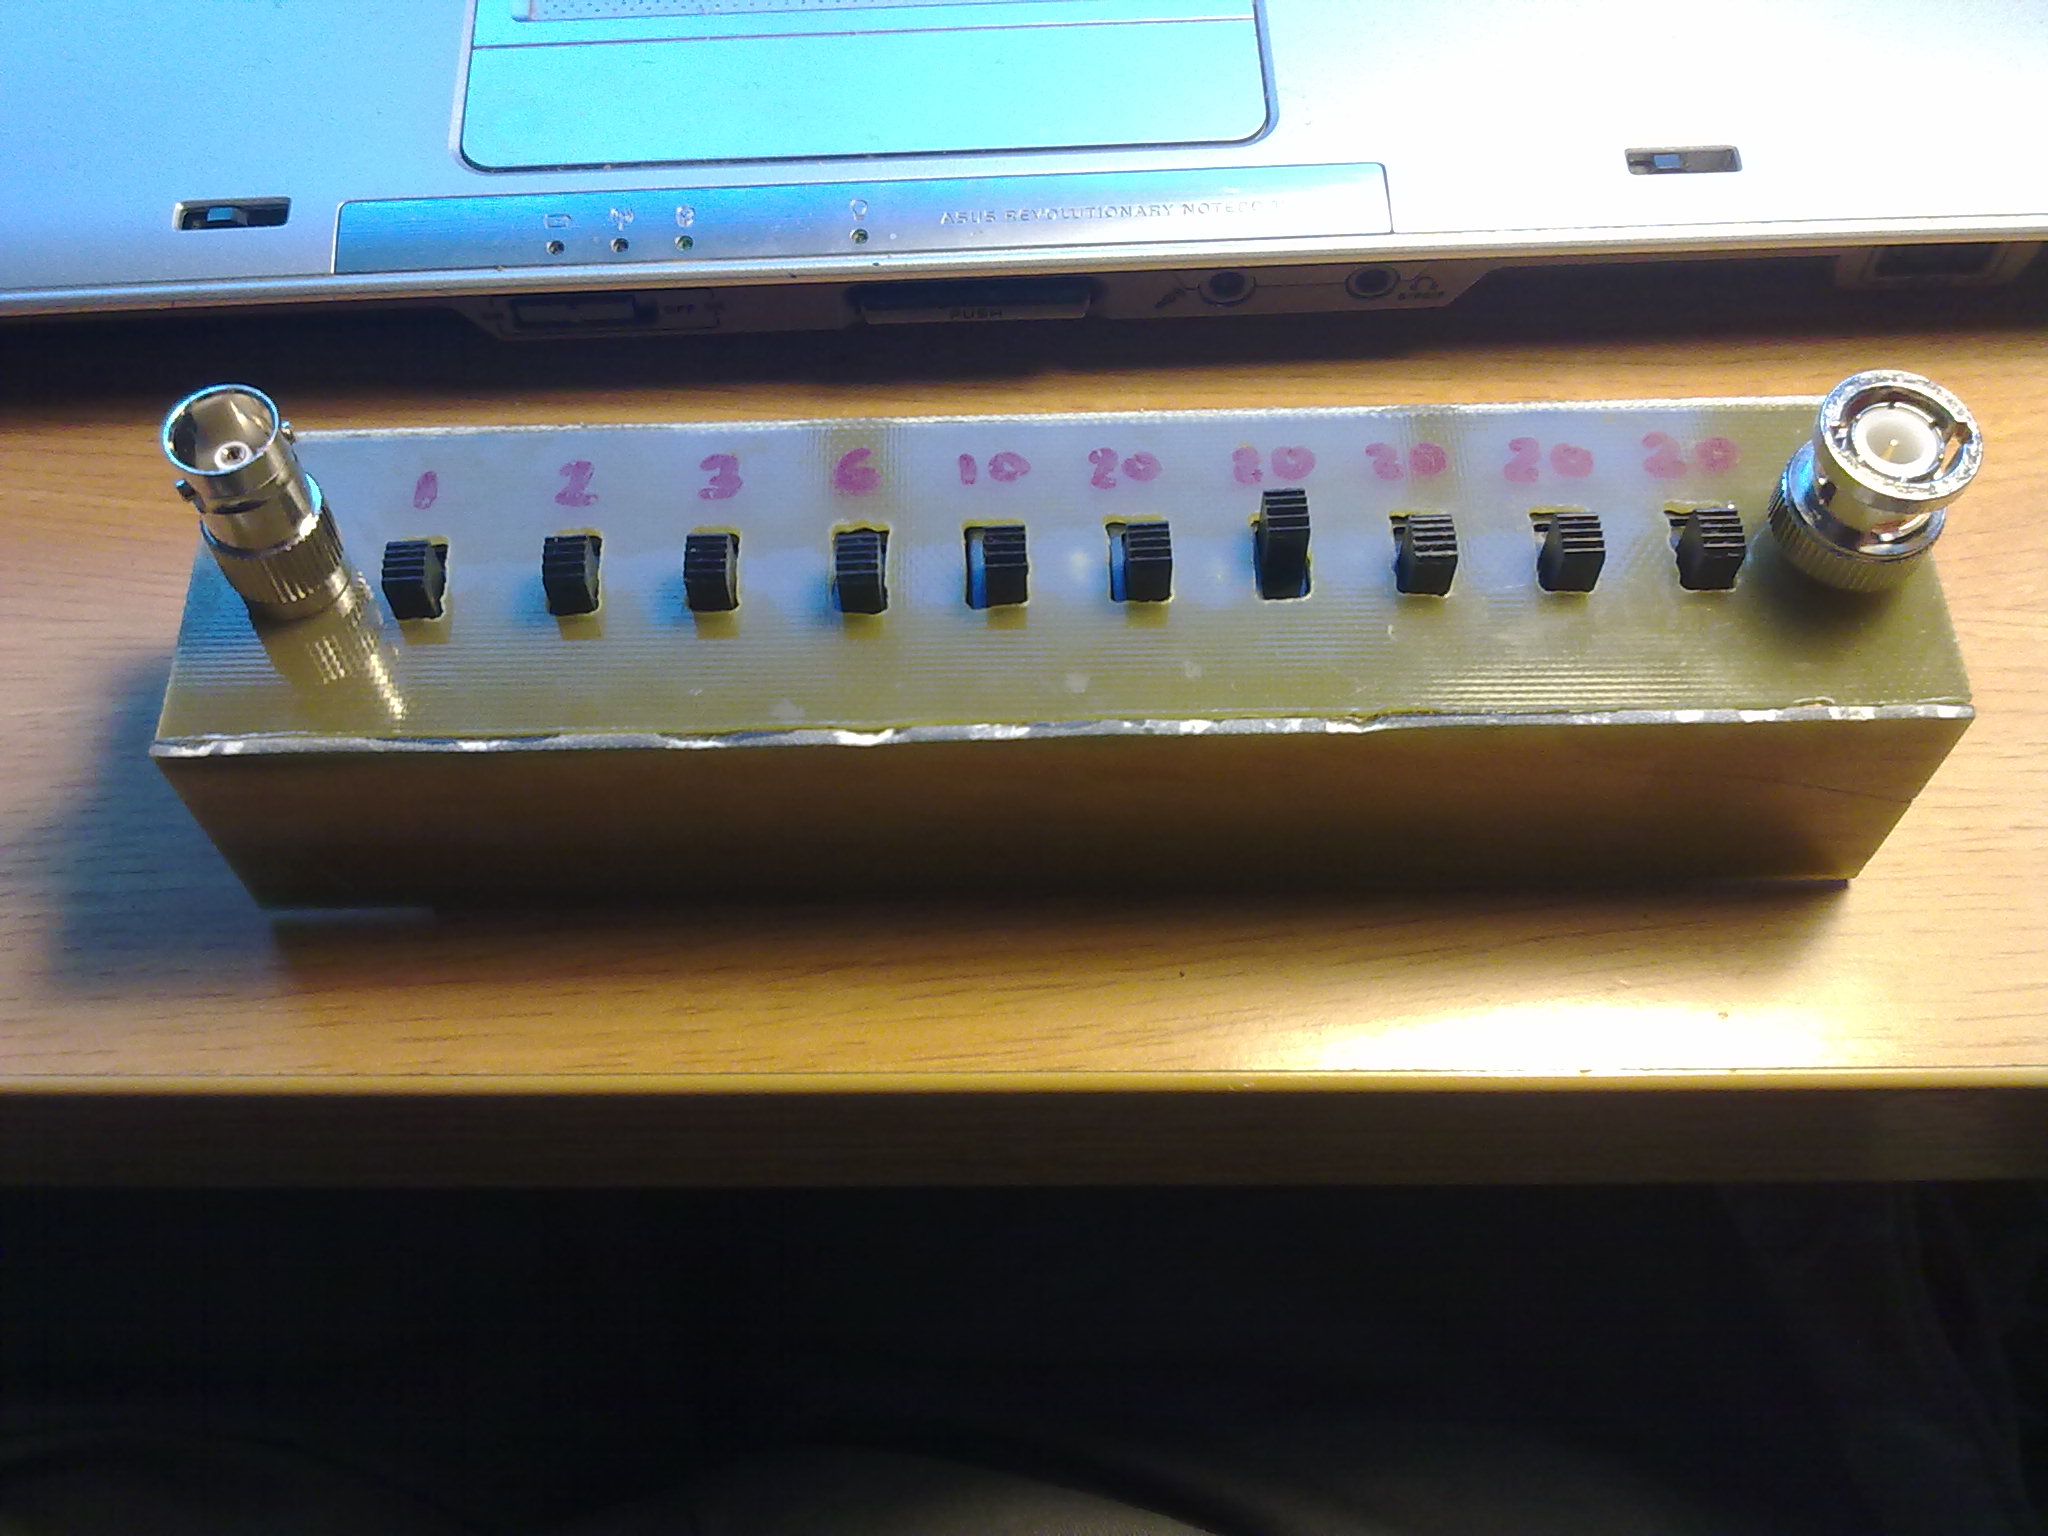
I tested the attenuator the hard way, that is, using a signal generator and a 50 ohm termination at oscilloscope input. It was a tedious and time consuming task. Now I own a network analizer, hope to measure it again some day.
Here we have the list of measurement data:
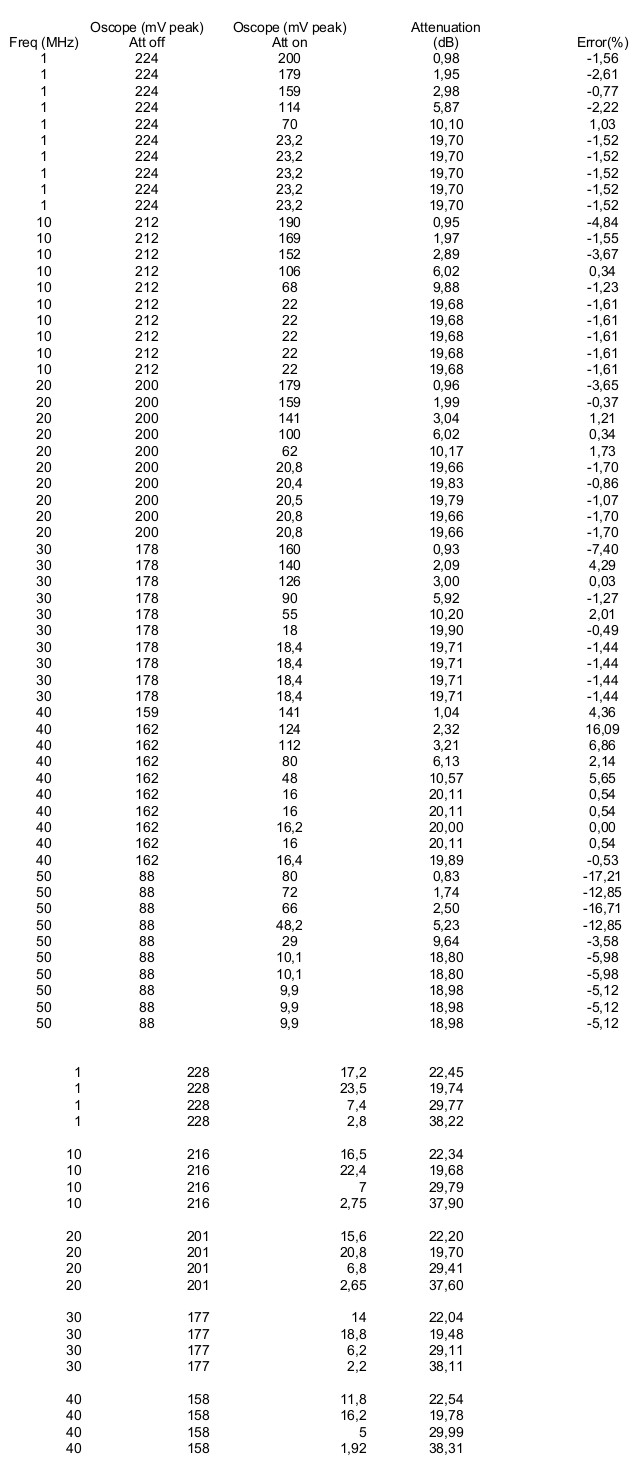
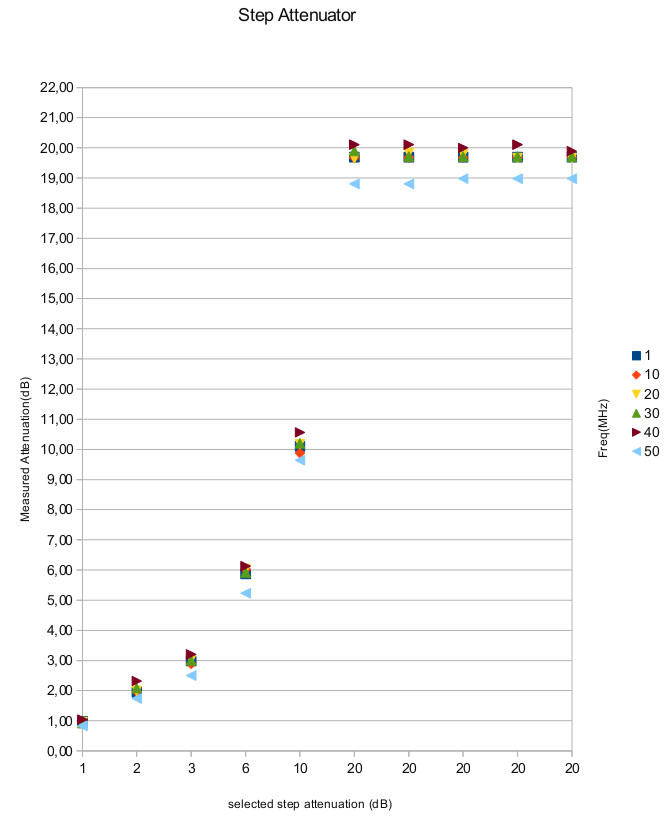
Graphical results of measured data:
Attenuator errors:
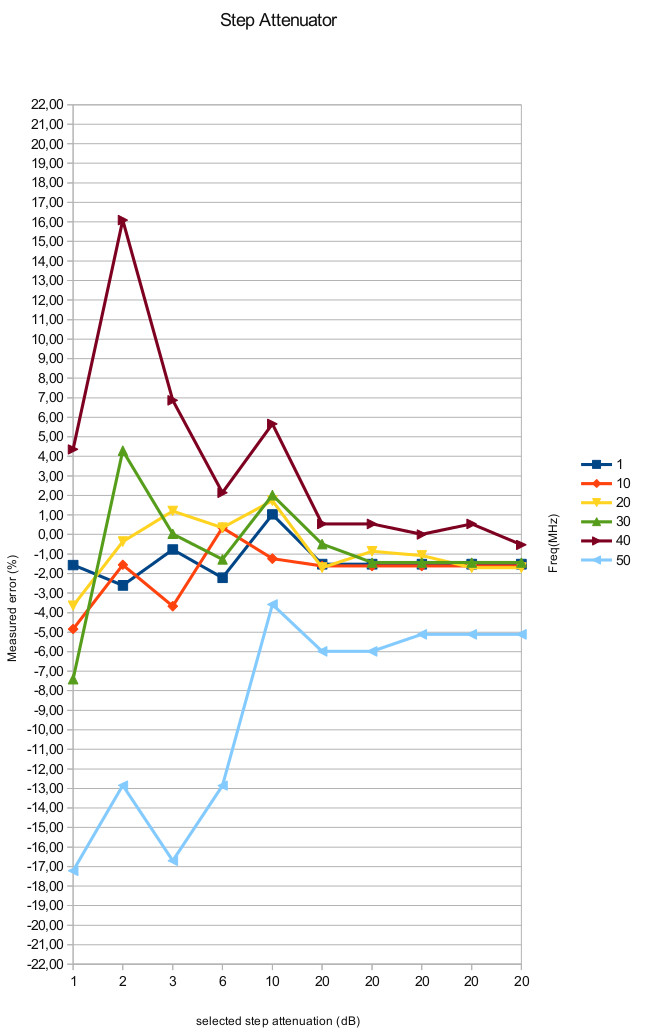
We can see that attenuator errors are bigger at higher frequencies. Also oscilloscope input capacitance could be worsening the situation. Another errors are caused because I could not find the exact required resistor values for each step.
Using a signal generator and an SDR receiver with Linrad software is an useful way of testing the attenuator. Let's see several screenshots on 14 MHz band using my home made Reinventing The Wheel SDR:
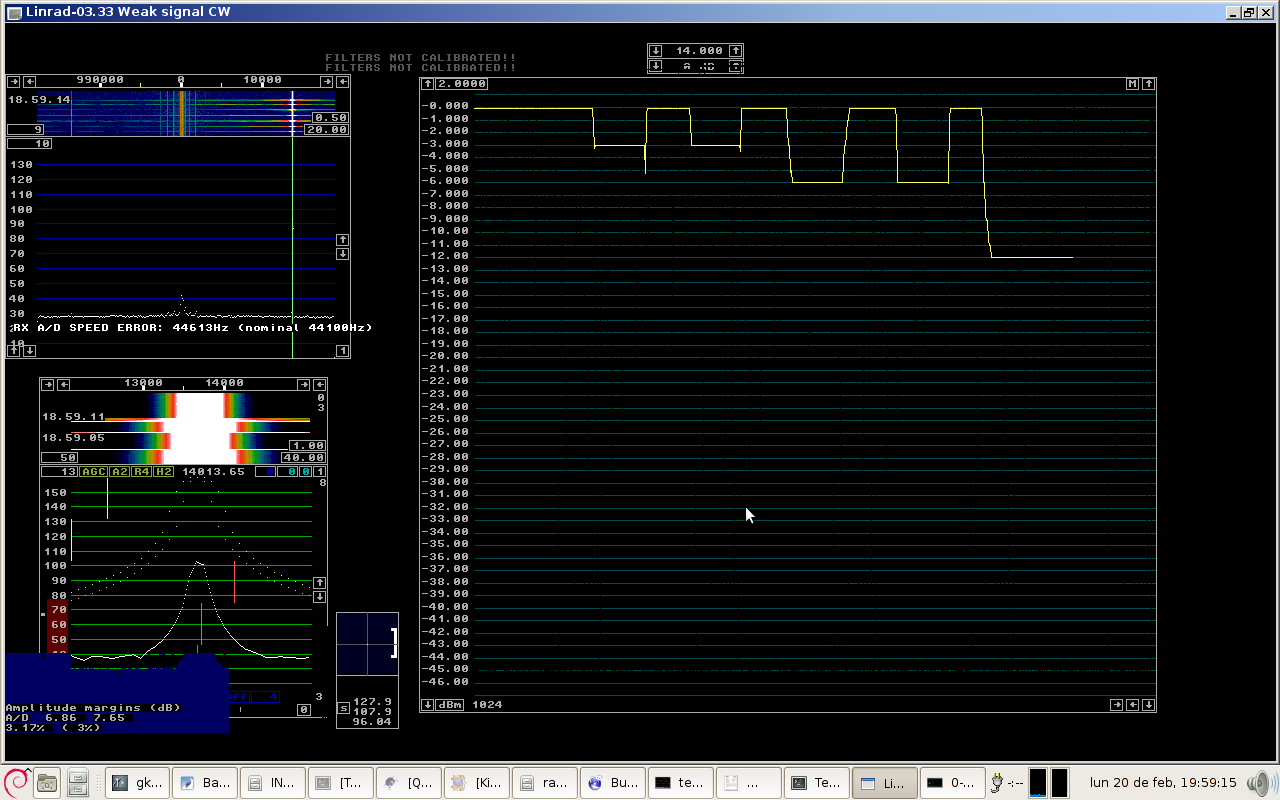
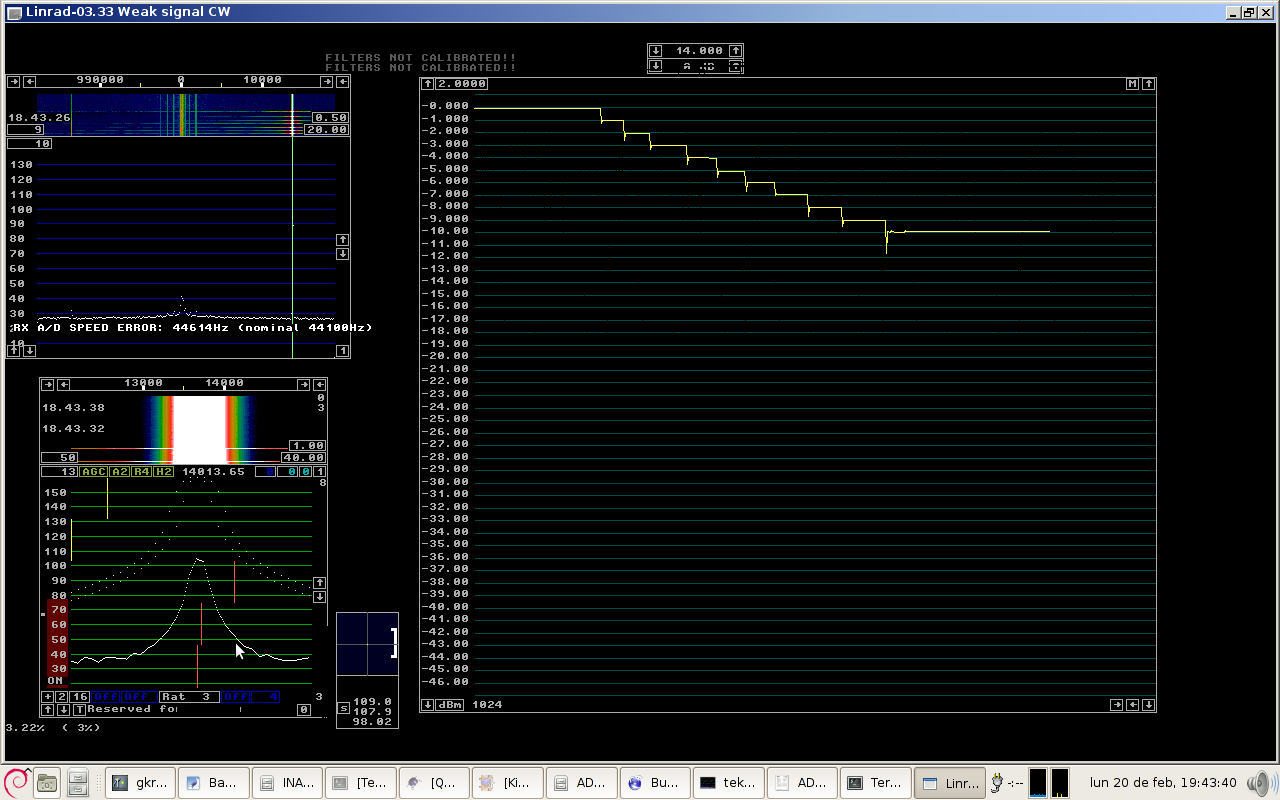
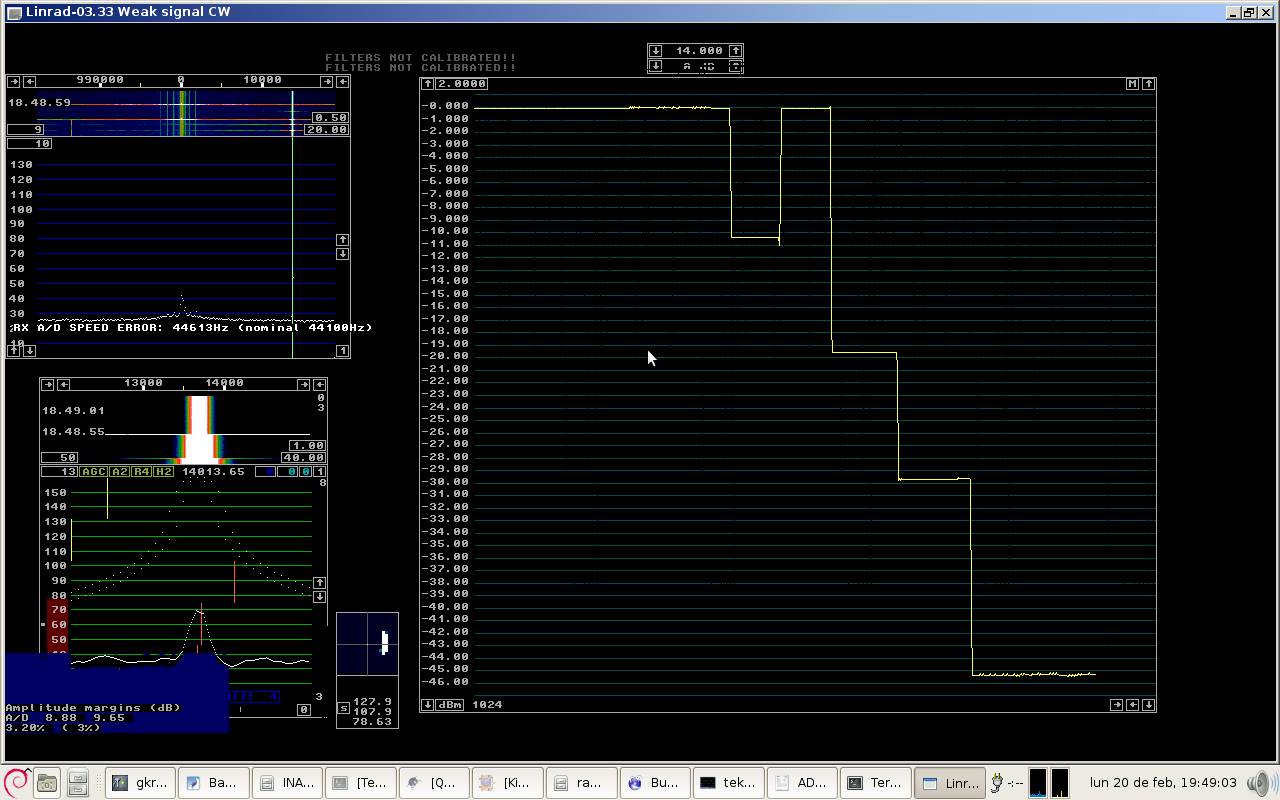
The attenuator could be improved somewhat getting resistors closer to the calculated values. Also adding very small capacitances to the wires could extend the high frequency range. I am lazy now to try that..... I hope you will enjoy building this useful piece of equipment as I did!
Experimental Methods In RF Design. ARRL. Wes Hayward, W7ZOI, Rick Campbell, KK7B, and Bob Larkin, W7PUA
  Copyright (c)  2013 Ramiro Aceves .
  Permission is granted to copy, distribute and/or modify this document
  under the terms of the GNU Free Documentation License, Version 1.2
  or any later version published by the Free Software Foundation;
  with no Invariant Sections, no Front-Cover Texts, and no Back-Cover
  Texts.  A copy of the license is included in the section entitled "GNU
  Free Documentation License".